-
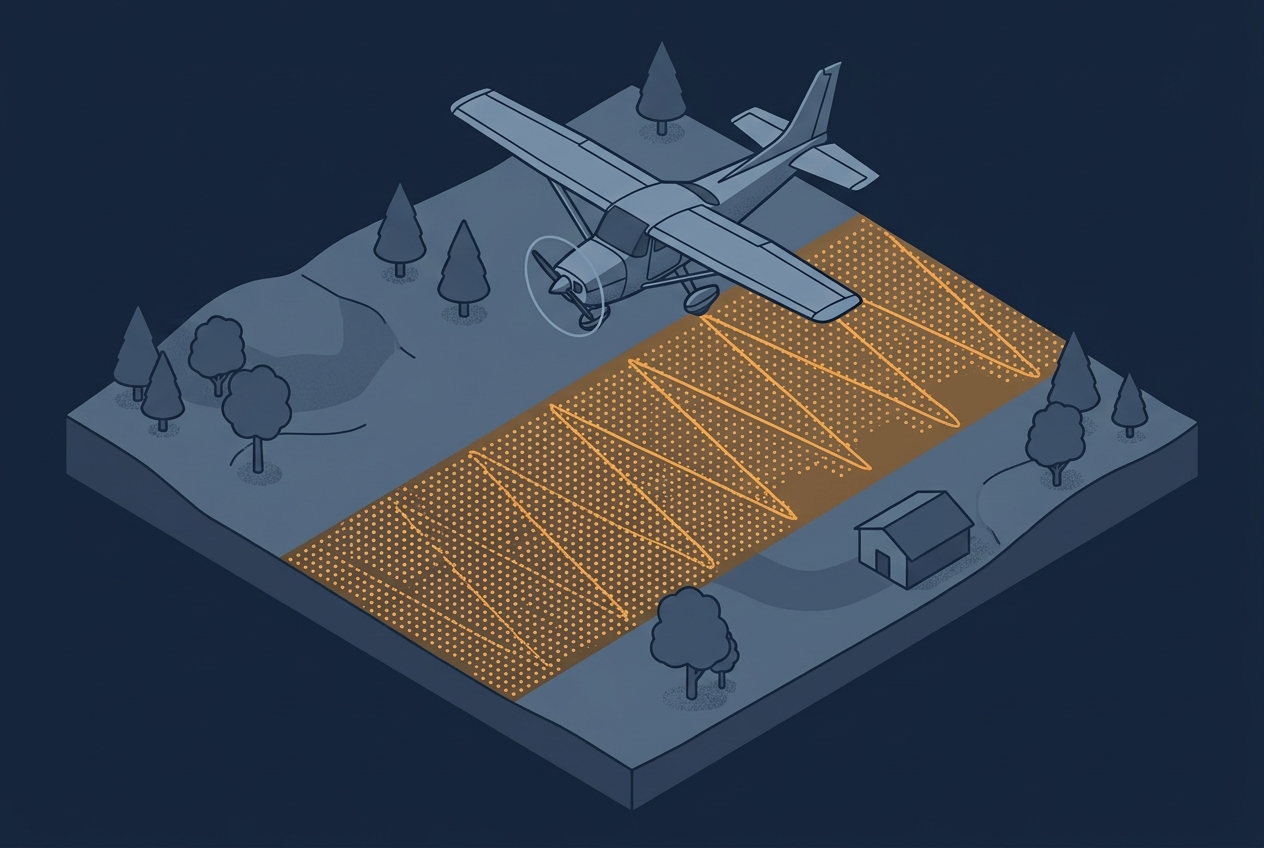
How Scan Pattern Shapes Point Density Across a Project Area
A project specification usually calls out a single number: 8 points per square meter, maybe 20 or even more. That number becomes the thing everyone plans around, quotes against, and checks in QA. Sometimes the spec is written as an average across the project area, sometimes as a minimum that has to be achieved in…
More Content
-
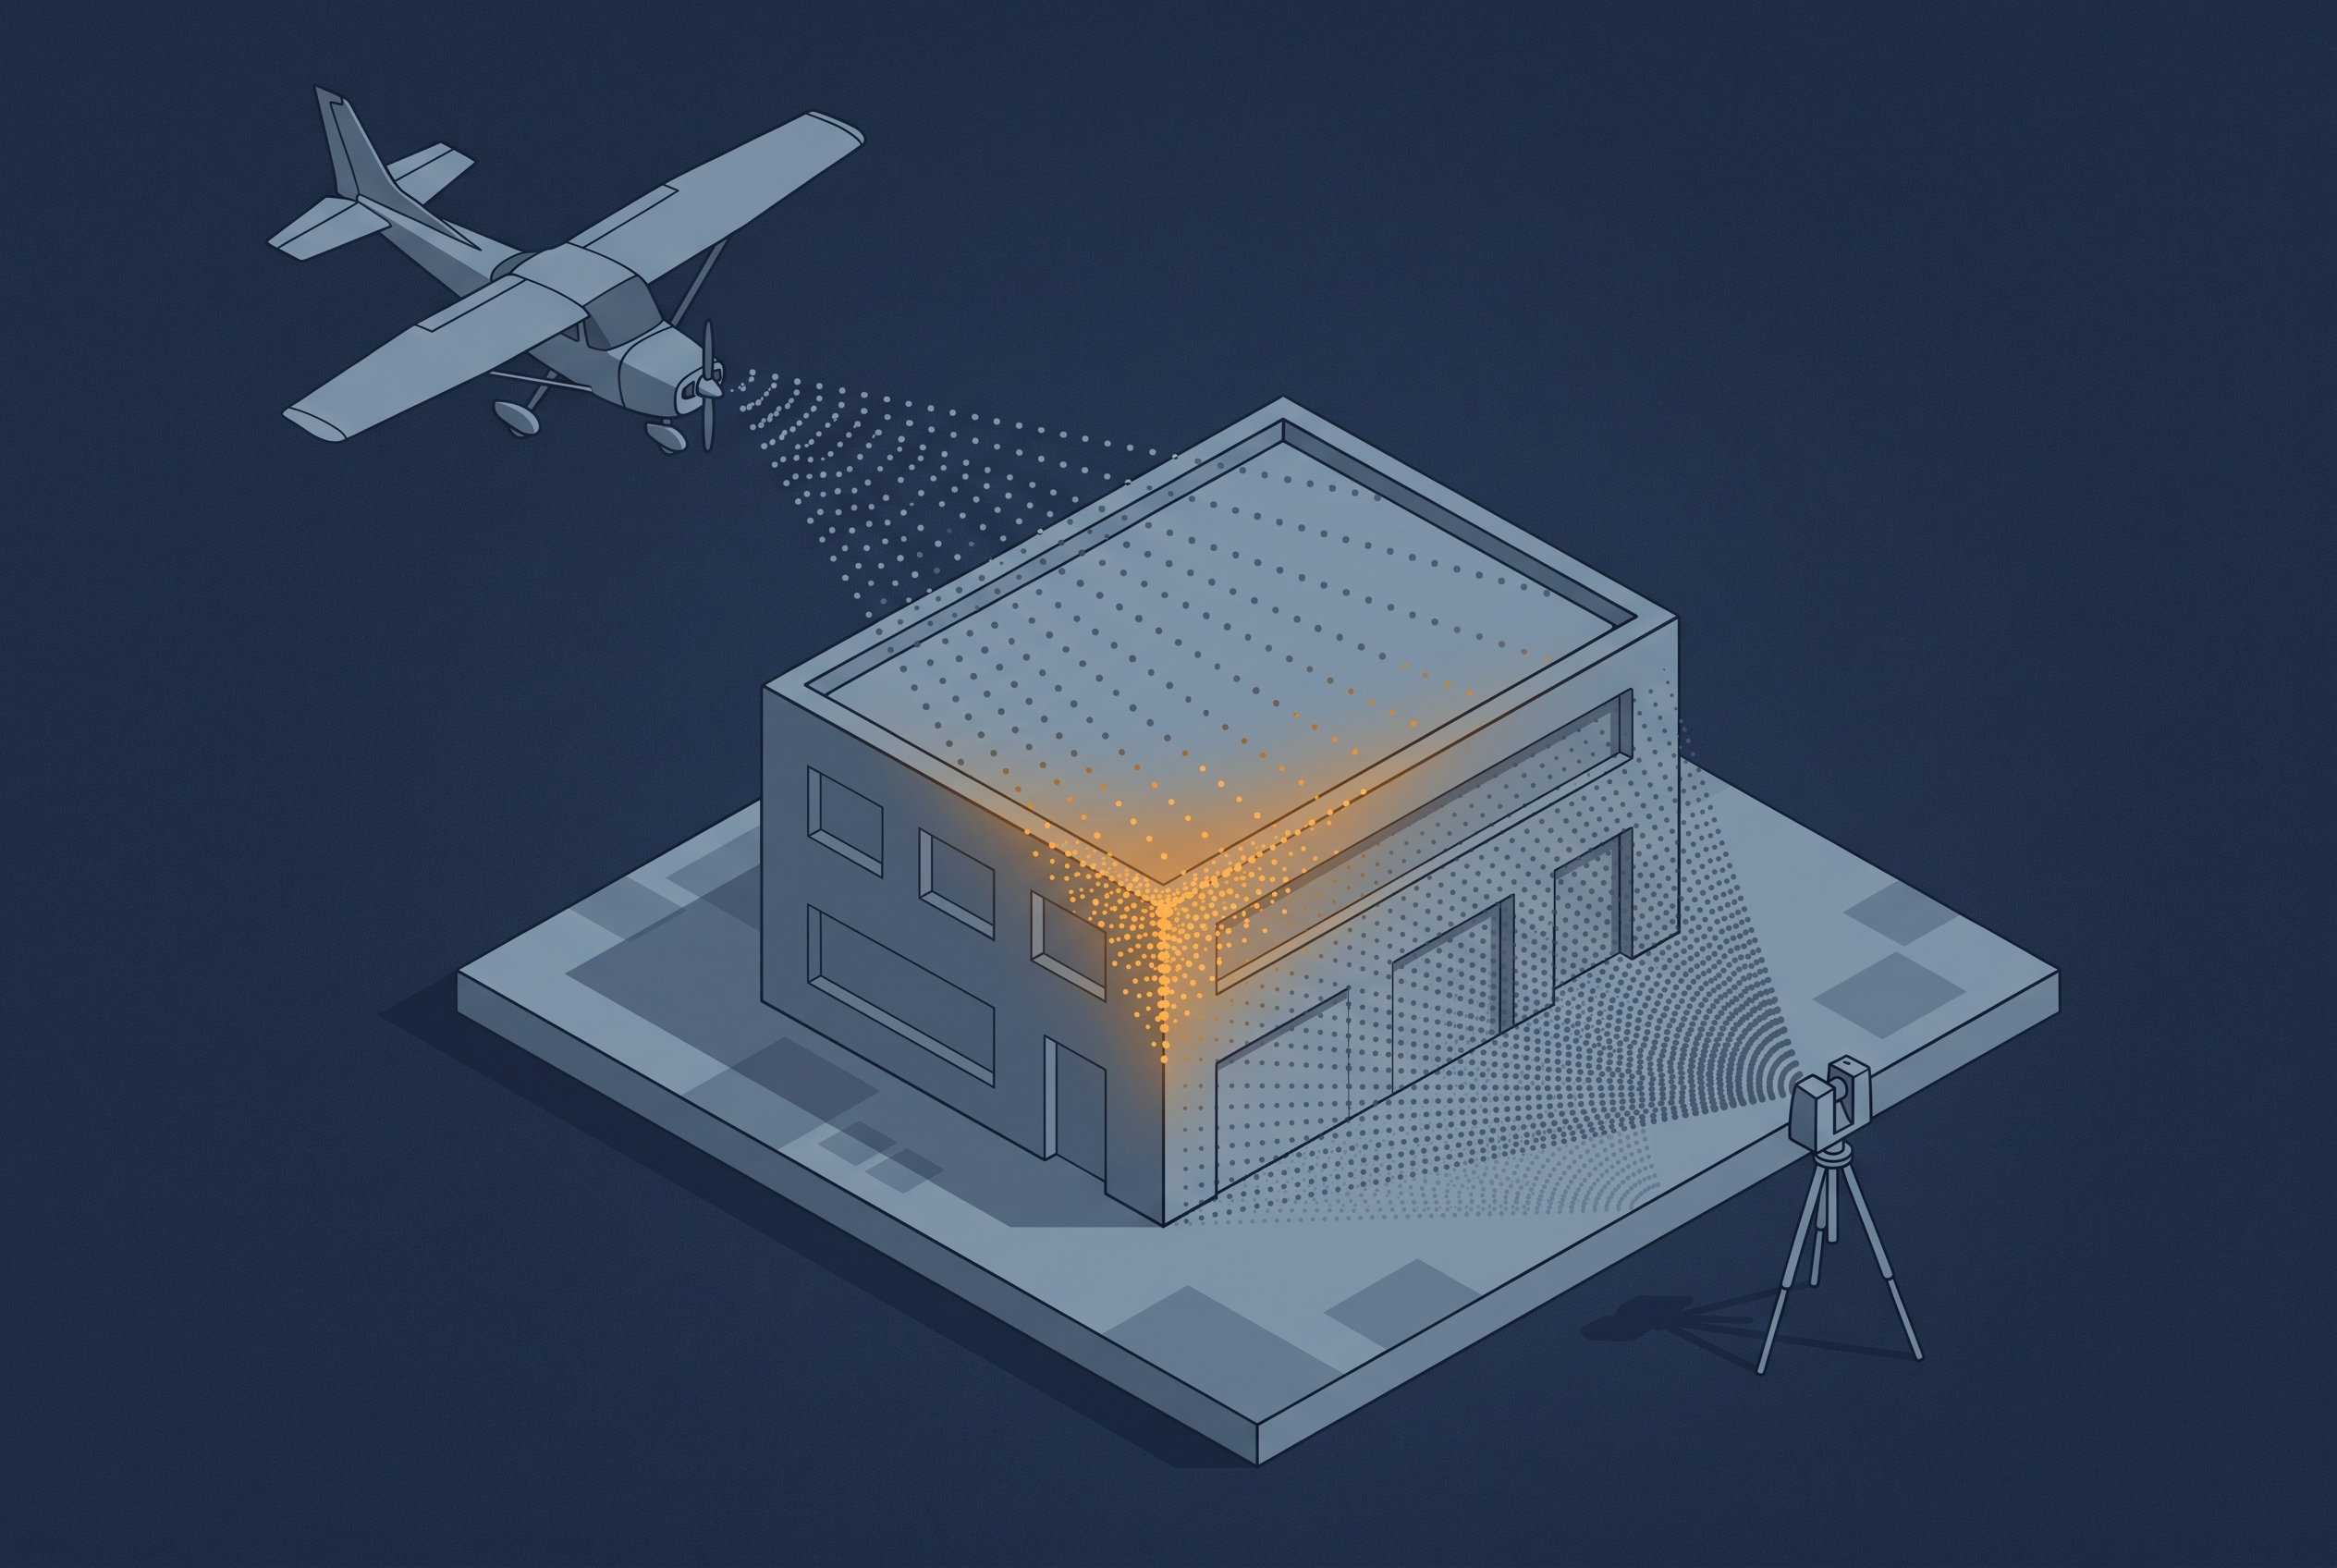
Where Things Go Wrong When Combining Different Data Sources
A drone can see a rooftop that a tripod-mounted scanner never will, and a terrestrial scanner can resolve a facade at a precision no aerial platform can match. That is one reason people combine sensor sources. The other reason is just as important: LiDAR and imagery do not capture the same information about a surface…
-

3D Gaussian Splatting Explained
If you have worked in aerial surveying for any length of time, you have probably come across a Gaussian splat by now. Maybe it was a flythrough of a drone survey over a construction site, or a visualization of a city block captured from a manned aircraft. Whatever the context, the first reaction tends to…
-

A Closer Look at LAS Formats
LAS is the dominant format for storing lidar point clouds maintained as an open standard by the OGC. Like most formats that have been around long enough, it has meanwhile accumulated versions. The version number on a LAS file is not just a timestamp – it tells you what the file can and cannot represent.…